PTC’s Technical Specialist for Mathcad, Anji Seberino, joined us on today’s webinar called “Plotting Your Success with Mathcad Prime 5.0” to demonstrate how 2D plots have evolved in PTC Mathcad. This information technology and leading engineering calculations software is the number one tool for designers and engineers in the industry. Download the PTC Mathcad Prime 5.0 brochure.
Let’s talk about plots. PTC listened to their customers and responded to suggestions and requests needed for Mathcad Prime. The old plotting method is still available for those that need to use it, although the new improvements gave plots the abilities to add a title, a legend, gridlines, axis labels, a 2nd y-axis, and richer formatting options.
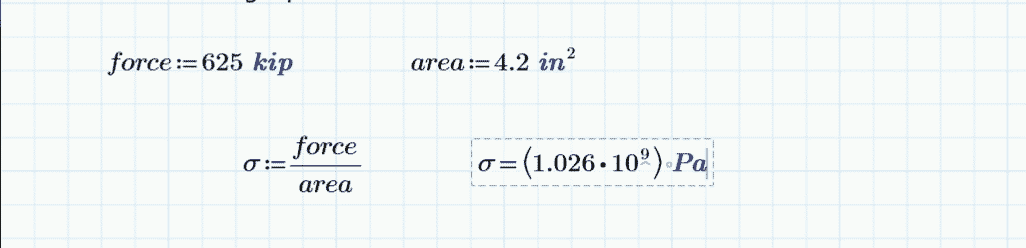
Anji demonstrates how you can calculate stress using input variables of force and area on your Mathcad worksheet:
The original way to create a plot in PTC Mathcad Prime 4.0 was to go to the ‘plots’ tab and click ‘insert plot’ – this function is still here.
With the old way (which you can still use), you would follow these instructions:
-insert plot
-x-axis= force
-y-axis= σ2
You can see that ‘force’ and ‘σ2’ are names of variables that store our mathematical data – but they are NOT labels. You cannot add the labels using this old method (but you can with the new).
The new way is NOT on the plots tab – it’s on the math tab – called the ‘chart component’.
-go to ‘math’ tab
-click on ‘chart component’
-right click on the chart, click on ‘insert x-axis expression’
-right click on the chart, click on ‘insert y-axis expression’
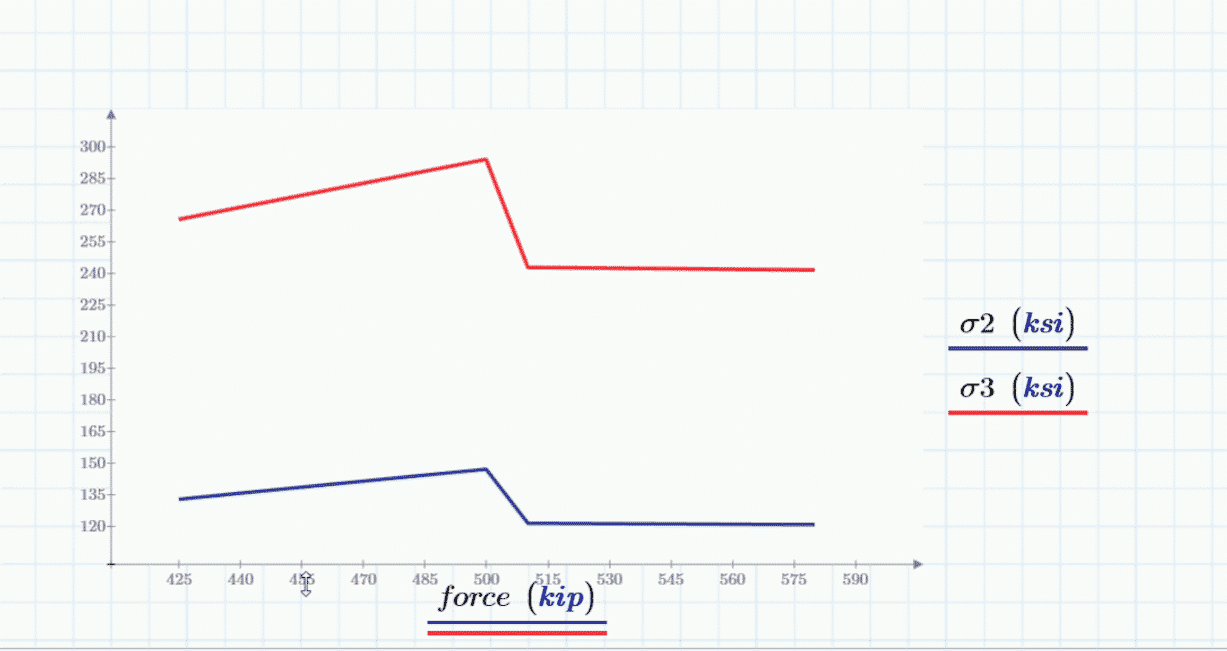
On previous version of Mathcad you could not enter a 2nd y-axis. Now you can:
-right click on the chart, click on ‘insert y-axis expression’
In the chart component you can access all the rich format options in one place with a lot more room to make the plot the way you want it to look with styles, the legend, a title and where you’d like the location of all of these components to be while being able to change background, text, and line colors, borders, and opacity settings.
PTC Mathcad helps you calculate and solve engineering problems. Much more can be done in charting your 2D plots in Mathcad Prime 5.0 – watch the webinar replay here.