
Often times we can find ourselves knowing where we want to go but not knowing where to start. This is a common theme when it comes to digital transformation. Not surprisingly, we have seen many of our customers use EAC assessments as the first step to open up a world of opportunities for their company to grow and evolve its processes.
JR Automation has been an EAC customer for over a decade, and when we first started working with them, the first action was an EAC assessment. We were able to provide them a customized roadmap for success and prove how JR was going to achieve it. EAC has helped JR Automation find ways to save time, save money and increase efficiency – with savings over $1.4 million every year. JR took the first step with EAC helping them to find that starting point. Today JR continues to find new ways to innovate and evolve with growing customer demands in a highly competitive marketplace.
What to Expect from an EAC Assessment
Assessments can seem daunting at first. You may be asking yourself questions like, “Are they going to come in and tell us all the things we are doing wrong?”
In reality, our goal with assessments is to identify your current state and production and manufacturing processes, assess the maturity of your operational technologies, and work with your team to pinpoint an ideal future state. Making transformational changes to a company can be a sizable cultural shift and we help companies prepare to make that change. There are risks you take when you don’t assess your current situation, and we want to help you minimize those risks.
Functional Group Assessment (FGA)
The EAC Functional Group Assessment provides an objective format for your functional groups to truly understand their creation, consumption, and delivery of product data. These groups could consist of any cross-sectional team members from engineering, design, manufacturing, sales, marketing, or management.
During an FGA, our team of subject-matter experts will work to understand how your key team members work daily to complete the product development process. After the evaluation is complete and our experts have uncovered your current processes and technology usage, we will help you establish a roadmap that will lead your company to higher productivity and savings across the board.
After our findings have been documented and studied, we will lay out new possible methods and functions to improve overall productivity. These recommendations could include ways to improve capability gaps, business policy improvements, procedures that ensure efficiency and alignment, or strategies for training to maintain efficiency.
The benefits of an FGA could span from understanding your Functional Group alignment to business objectives and initiatives and their use of existing toolsets to examining processes and daily tasks that reflect your current state. We also uncover overall awareness of opportunities for improvement and bring alignment to Functional Vision for your desired future state.
Ultimately, we help you create a plan to achieve that desired state so you can spend less time wondering how to grow and more time-saving money through innovation. Companies like ITW Paslode and Nordco have taken advantage of the FGA and have seen the financial value in getting started on the transformational journey.
Digital Transformation Assessment (DTA)
Similar to the FGA, a Digital Transformation Assessment is an EAC-provided service that explores an organization’s product development system functionality. Our experts look at an organization’s operations and provide broad insight into improvement initiatives and establish a strategy for achieving operational improvement of a product development system.
When working through this assessment, our team has candid one-on-one discussions with your team members where we uncover what is working well, any occurred costs, and evaluate optimization opportunities.
The results that stem from an EAC Assessment are unmatched. Companies are discovering data they never knew were siloed, teams that were frustrated with processes, and many other disruptions in production. After uprooting and addressing these issues, companies like JR Automation, HyrdaForce, DRS, Merrick, and Systems Control are able quote more business and respond to customers faster – increasing their profit as well as employee and customer satisfaction.
Streamlined Digital Transformation Assessment (SDTA)
Similar to the functional DTA, the Streamlined Digital Transformation Assessment focuses on the interviews and direct inputs from your team members. However, it does not include an online survey and corresponding metric output. This assessment is offered as one variation of the Digital Transformation Assessment to fit your specific needs.
This assessment is a great fit for companies that have the desire to optimize their product development system, have the approval to move forward with the optimization, but are unsure where to start or what to focus on first.
While there are a few exclusions from the full DTA in this assessment, our team still coordinates select participants to plan and schedule the execution of individual interviews with participants involved in the assessment. This process will be a higher level approach than a full DTA, and may not include as many details or metrics. This assessment is still an excellent tool to explore your current business functions and define a roadmap to success.
Digital Manufacturing Assessment (DMA)
The Digital Manufacturing Assessment evaluates the overall state of your current product development systems regarding IoT initiatives, provides broad organizational visibility to improvement initiatives and identifies an IoT solution roadmap to help you determine the very first steps you should take on your digital transformational journey.
After evaluating your current manufacturing practices and operations, our experts will identify the best opportunities for growth that align with your corporate goals. When Kimray did a DMA with our team, they were able to recognize technology and solutions that would integrate with their current processes and also propel them to the next level in production. Together we developed a strategic roadmap that enhanced their processes.
The opportunities and pathways are endless to how your company can achieve digital transformation in the same way – a DMA is a great place to start.
Value Stream Mapping Assessment (VSMA)
A Value Stream Mapping Assessment consists of documenting the key action steps during production, gathering information from inputs and outputs, examining the systems used to manage that information, and pinpointing key optimization opportunities at each step. After, our experts work with your team to define an ideal future state of your product development process. The future process documentation outlines key improvements needed in business principles, policies, processes, and procedures utilizing the latest systems available to you to facilitate those improvements. Our EAC experts then defines a high-level roadmap and guidance on how to achieve those improvements.
During a VSMA, your team can expect to receive an important strategy that documents your current state including process documentation, pains, and what those pains are costing your business. With this information, together we will curate the vision of your future state – what your development could be – and create a roadmap on how to get there.
The company MEANS had EAC come in for a VSMA and was able to get a roadmap on system integrations that opened up the opportunities for better processes to connect their company. With an EAC roadmap, MEANS was able to realize a future state of streamlined processes to get their product to market faster and with less downtime.
When to Start
Now that we’ve answered the “what” and “why” of EAC assessments, the next question is “when.” Knowing you want to take your business to the next level, but feeling like you don’t how or where to start is the perfect time to invest in an assessment. Our ultimate goal is to understand your unique enterprise, your corporate strategic goals, and its current state, define your ideal future state, and plan an achievable way to get there together. EAC’s Assessment services can be the stepping stones for long-term company success and Digital Transformation.
Want to hear more testimonials or see which assessment would fit your company best and see how we could transform the way you do business? Connect with one of our experts!
They say a picture is worth a thousand words, so here’s a hypothetical situation to paint the story ‘how real-time information and predictive analytics unlock value.’
To start, imagine a fully functioning assembly line with a robot, a pneumatic system, a series of conveyors, and a vision system.
Let’s pretend the supply station in the back is bringing in our raw materials. The robot is assembling those materials with precision. The resulting assemblies are then passed on to the quality station, and the vision system inspects each of those assemblies to ensure proper alignment of the parts.
This is a pretty generic operation, but it can show how unified real-time information and predictive analytics unlock value.
Now imagine yourself as a maintenance engineer, who wants to check the status of your asset pool.
Using software, such as ThingWorx Navigate by PTC for example, you launch a role-based maintenance application. All of a sudden you see a complete list of your assets with real-time performance stats and relevant alerts or notifications. You also have a complete list of all your outstanding maintenance work orders.
From here, you have the ability to drill into any of your assets, but you start with the quality station. You immediately see the key characteristics of the station. You see that speed vibration and temperature are all operating within their specified range. You could also see notifications of any warnings, malfunctions, or potential future problems.
Next, you use your device to take a look at the pneumatic system. The pneumatic system also looks fine. Both pressure and flow are operating within the specified range, and there are no outstanding maintenance tickets or work order notifications on your screen.
Now, let’s consider a situation where there was a leak in the pneumatic system. Let’s say a loose fitting was releasing pressure, a fairly common problem in pneumatic systems. Now, rather than looking fine, your device displays flow readings outside of the designated operating range. Furthermore, an alert has automatically been sent to notify you that a system has an error. The overall status indicator on your screen has now switched from green to orange – operational, but not optimal.
Your software solution’s machine learning is now predicting that this air leak, if not repaired, will result in a pneumatic gate failure in approximately 10 day’s time. The good news for you is the system has already issued you a maintenance work order to address the problem before asset failure and unplanned downtime.
This scenario is made possible by a system equipped with primary and secondary sensors, and a complete Industrial Internet of Things (IIoT) solution that can turn raw machine data into valuable information.
For example, your pneumatic system has an airflow sensor, as well as a pressure sensor. The conveyor systems are equipped with motor temperature sensors and vibration sensors.
You have also used your software to integrate manufacturing floor systems with real-time IT applications, asset maintenance tools, and ERP systems. This provides you with a real-time alignment of your IT and OT systems.
Now, all of your systems are throwing data out at a staggering 800 data points per second.
Your software’s machine learning then uses that real-time streaming data to establish a baseline of normal operating conditions. This way it can immediately connect and broadcast any anomalies that occur. It uses these anomalies, in conjunction with its prediction capabilities to notify you of future problems, just as in the case of the pneumatic failure.
Now that you have an understanding of what is happening under the hood, let’s take a look at how all this comes together to enable real-time operational intelligence.
On your device, you notice an orange status indicator on line one (that was created from the air leak earlier). Once that air leak has been repaired, everything returns back to normal, just as you would expect.
Let’s explore one more hypothetical situation. Consider yourself to be an operator. In this case, you have just been assigned a new order for a thousand units that need to be delivered and expedited for an end-of-day delivery.
You’re notified of the order and in this smart connected scenario you, as an operator have a single portal from which you can see and execute all of your work. Through a single pane of glass, you now have access to your business systems information and your operational data including the KPIs from your line.
On your device, you also have up-to-the-minute visibility of the OEE (Overall Equipment Effectiveness). You see real-time data measurements of your manufacturing operation’s availability, quality, and performance.
Let’s see how some of these metrics might change if we go ahead and speed up the line to accelerate the current order, in order to make room for that expedited order.
To do that you switch the line speed from level one to level two. What you see in seconds on your device is that line speed has increased, and your assemblies are still passing the quality check.
Within a couple of minutes and a few additional cycles, on your device, you see both your performance and OEE trending upwards.
As an operator, you now are assured that you are going to meet your end-of-the-day deadline.
Using these hypothetical situations, together we have painted a picture demonstrating how you can connect disparate assets from different vendors, to provide real-time information.
You’ve also seen how you can leverage role-based applications that combine business systems information and operational data to empower your workforce with real-time actionable intelligence.
By integrating machine-learning capabilities you brought a whole new level of predictive intelligence to your factory floor, identified problems, and resolved issues with minimal impact on operational performance.
This is exactly how real-time information and predictive analytics can unlock value for your organization.
We transform the way companies design, manufacture, connect to, and service their products. To fully grasp how we assist and serve our customers, you need to understand our core organizational beliefs:
- We believe the product development process is broken.
- We believe that there is a better way to achieve business initiatives through product development processes and it all starts with learning.
This is exactly why we created the EAC Value Model. We’re a learn first organization. We focus on taking the LAMDA approach.
What is LAMDA?
The LAMDA is a basic learning cycle of lean product and process development. It literally stands for “look, ask, model, discuss, and act.” Ideologically it is a way to learn and optimize within a closed-loop learning cycle that continually looks to improve a situation by defining and improving root-cause issues.
Our LAMDA based EAC Value Model works as follows.
The first phase of the EAC Value Model: Learn
During the learn phase, our specialists take a first-hand approach with your business. This is when we learn about your business initiatives, ask open-ended questions, and gather information so we can truly understand the key drivers of your business’ success, any the root-cause of any potential areas of improvement.
Throughout this phase we take time to learn about your people, your team, your processes, your technology, and the ways of your organization.
We take an in-depth look at your business from front-office to back-office to determine the how your company can extract the most value from its interaction with EAC.
This leads us to the second phase of the EAC Value Model – The Mutually Agreed Upon Plan or M.A.P.
The second phase of the EAC Value Model: The M.A.P.
Using the knowledge acquired from our learning exercise, our team creates a unique customized M.A.P for your organization. Your M.A.P. is a Mutually Agreed Upon Plan that incorporates a multiple step strategy, with actionable steps and business cases for your organization.
This phase provides an understanding of what needs to be accomplished in order to achieve your desired results.
Throughout this process we evaluate solutions that may address your organizational needs. Wither they may be through engineering services, educational training services, product development consultations, system implementation services, software solutions; we configure a plan to fit your specific needs.
The creation of the M.A.P. provides a clear path to value for your organization. It holds everyone accountable for the actions needed to solve business problems and tackle initiatives.
Once we have created your mutually agreed upon plan, the implementation phase begins.
The third phase of the EAC Value Model: Implementation
During the implementation phase we put the M.A.P. into action. This is where our teams move your solution from the developmental stage into production.
You could also refer to this stage as ‘deployment’, ‘go live’, ‘roll-out, or even ‘installation’.
The tasks performed during this phase might include installing or implementing CAD, Windchill, Industrial Automation, IoT or any number of other systems. Perhaps your M.A.P. incorporated training programs for your current teams or additional services for product information. No matter what your plan includes, our team works with you to provide any service, system, or additional skill necessary to achieve your desired results.
Throughout this phase our focus remains on helping your organization become a smart, connected enterprise.
The fourth phase of the EAC Value Model: The Score Card
This is the phase that sets EAC apart. Once we have implemented your solution(s), we never lose focus on gathering feedback on how we did, how a solution is working, or whether the desired outcome or return on investment is being realized…
Remember, our overall goal is to build a long-term relationship with your organization. We feel the best way to do this is by making sure you achieve the success your company needs.
Our business is built around the way your company designs, manufactures, services and connects your products and we recognize, its’ happy customers like you who keep us in business!
With the help of our EAC Score card, we obtain your feedback on how we can continue to help your organization grow.
Our dream for your organization is to create a smart connected enterprise where you have the ability to connect to your products, your shop floor, and know your predictive downtime before it even happens. We make it our priority to help your organization achieve more than you had had imagined.
Evolving your BoM strategy, tools, and abilities. “EBoM vs. MBoM” transforms into “EBoM integrates with MBoM.” This integration includes associativity to one another, time saving tools, elimination of error prone manual steps & more.
Imagine eliminating the common disjointed processes, additional time, and error prone manual steps involved in the creation of downstream BoMs from Engineering into Manufacturing, Production and Service management.
Concepts & examples such as Manufacturing Bill of Materials (MBoM) are shown below, all under one system, integrated & associated, and created with a single click. Then they’re easily edited to meet downstream BoM needs.
BoM creation can be streamlined & improved by associatively creating downstream BoMs (S or M or other) and eventually, connecting them to your ERP system. For now, we’ll focus on the first step of this business transformation concept; the creation of the second, or downstream M or SBoM, starting with a simple EBoM example, created in minutes, and easily viewed & tracked.
Who should be involved in this topic at your company? Ideally, your Configuration Manager role should be leading or heavily involved in this process.
The starting point & tool is PTCs Windchill and your willingness to change & improve.
Once your CAD data is ready to check into Windchill, there is an option (check box) to auto-associate the EBoM to a downstream BoM such as an MBoM. It is a 1:1 relationship for starters. Options can branch out from here into many CM (Configuration Management) directions. Such as multi-level BoM management, uses, visualization and more.
Once created, you can manipulate & edit the default 1:1 downstream BoM to your needs; adding bulk items, manufacturing specific sub assemblies, (build throughs) even new service end items. You can also flatten out an EBoM to meet assembly or production needs. BoM items such as adhesive, lubricant, paint or coatings, packaging items, all things that typically are not on an EBoM, can and do belong on the M or SBoM.
If this fits your company’s needs? consider using Windchill’s auto-associate feature.
This article covers a couple examples. If this is not deep enough…here are even more tools to consider. Topics such as creating associated manufacturing instructions, work instructions, work plans and more. Change Management is shown as reference only, it is an optional element of Windchill for another blog.
There are many options to this topic, these are common examples that fit a lot of needs and is considered a starting point.
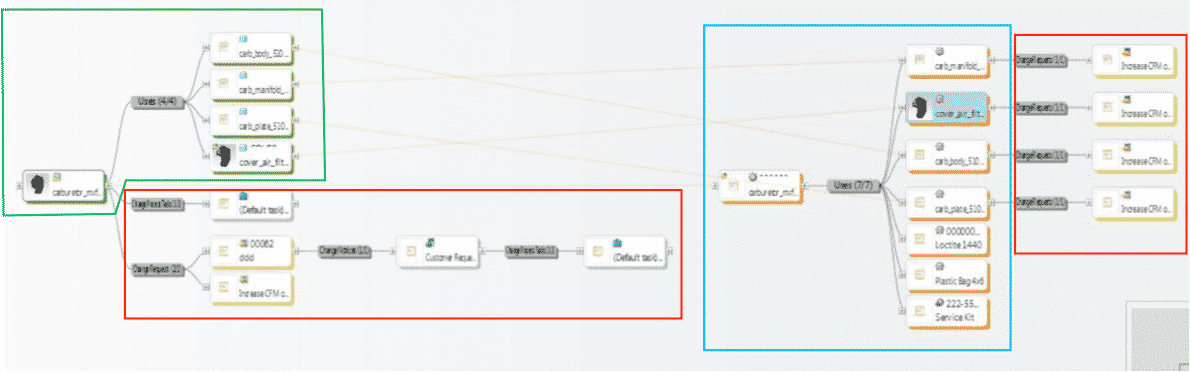
1st example shows all BoM & change components all connected in one system vs. manually done in silo fashion, which is industry’s most common method today. These examples are shown in PTCs Windchill reference viewer tool, which ties all related objects into view for easy visibility with just a few clicks.
- 1. EBoM structure (highlighted in green)
- 2. Change requests, notices and tasks (highlighted in red)
- 3. MBoM structure (highlighted in blue) with their own, or connected Change Management Requests, Notices & Tasks
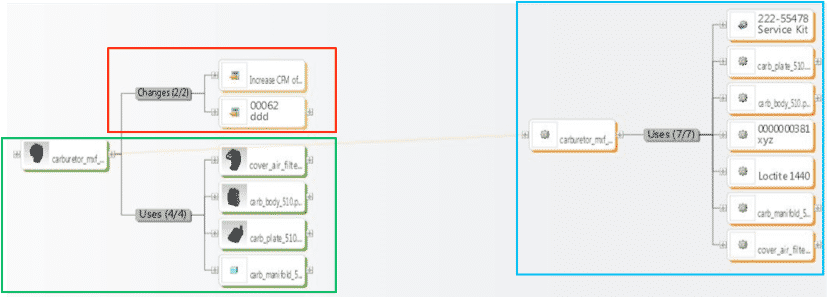
2ndexample shows an EBoM, SBoM (Service Kit in this example), with a saleable end item service kit, as well as components for service or manufacturing BoMs. It also shows Changes, these can also be created, edited, routed, approved or rejected, and even include the SBoM if need be.
Please connect with EAC to learn more, to discover your company’s transformation opportunities with an assessment, maybe see a demo, or attend a webinar. The goal is to help your company transform how you design, manufacture, connect to and service your products.
