- Natural math notation
- Automatic update of calculations
- Algebra and trigonometry operators and functions
- Comprehensive documentation (integrating live math, text, plots, and images in one spot)
- X-Y Plotting
- Automatic unit checking and conversion
- Basic numeric functions and operators
PTC Mathcad is an engineering calculations software that allows you to perform, analyze, document, and share calculations easily. To put it simply – Mathcad Express is a free version of Mathcad Prime with lifetime limited functionalities.
When you download PTC Mathcad Express, you are able to access full capabilities that you would with the licensed version of PTC Mathcad Prime 6.0 for the first 30 days. At the end of 30 days, you’ll lose the advanced math notations but will still have lifetime access to PTC Mathcad Express.
PTC Mathcad Capabilities
*Available for the first 30 days in Mathcad Express
| Express | Subscription | |
| PTC Mathcad Express | Individual/Multiple Licenses | |
| New in Prime 6.0 | ||
| Spell Check* | * | X |
| Hyperlinks in Text* | * | X |
| Custom Margin, Header, Footer Sizes* | * | X |
| Usability | ||
| Write Equations using Natural Math Notation | X | X |
| Basic Math | ||
| Automatic update of calculations | X | X |
| Algebra and trigonometry operators and functions | X | X |
| Documentation | ||
| Comprehensive documentation | X | X |
| Standardize engineering process using templates* | * | X |
| Content Protection* | * | X |
| Equation Wrapping* | * | X |
| Plotting | ||
| X-Y Plots | X | X |
| Advanced plot types: Polar, Contour, 3D* | * | X |
| Advanced Math | ||
| Programming* | * | X |
| Solve systems of linear, non-linear, and differential equations | – | X |
| Evaluate expressions symbolically* | * | X |
| Embed Excel directly in your worksheet* | * | X |
| Advanced Engineering Mathematics: e.g. Design of Experiments, Differential Equations, Solving Regression* | * | X |
| Advanced Numeric Functions: e.g. Fourier Transforms, Signal Processing, Statistics & Data Analysis* | * | X |
| License Options | ||
| Centralized IT management and administration | – | X |
| eLearning Libraries | – | X |
PTC Mathcad Express includes:
Mathcad Premium (licensed version of Mathcad) includes:
- Spellcheck, hyperlinks, and customized margins, headers, footers
- Excel component (integration with Microsoft Excel spreadsheets)
- Content protection (protect content with passwords, locking, and degree of access)
- Solving and optimization
- Programming (customizing your environment to meet your specific requirements)
- Templates (simply use templates as a basis for your new worksheets)
- Advanced plotting
- Symbolics engine (analytics/theoretical approach to math)
- Export to Microsoft Word (ability to save as word document file)
- Advanced math functions (perform linear algebra, non-linear algebra, or matrix manipulations)
Mathcad Free Trial
Download PTC Mathcad Express for a 30 day trial of what you can expect from a fully licensed version of PTC MC Prime 6.0 and when you’re ready to purchase a license, contact us.
FAQ
Can a Mathcad Prime file be opened in Mathcad Express?
Mathcad worksheets that are created with the fully licensed version of Mathcad Prime can be opened in Mathcad Express. In MC Express, edits can be made to the text. In MC Express, any edits made to the math that utilizes a premium feature will issue a message to the user indicating that the feature requires a license. Math created with premium features will not calculate in MC Express. Accordingly, math created with Express/non-premium features will in-fact recalculate in MC Express.
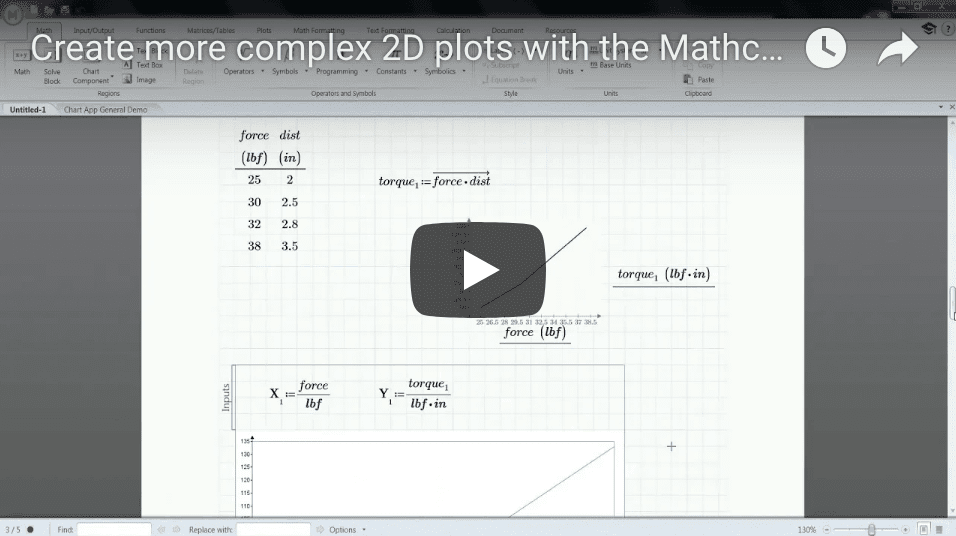
PTC’s Technical Specialist for Mathcad, Anji Seberino, joined us on today’s webinar called “Plotting Your Success with Mathcad Prime 5.0” to demonstrate how 2D plots have evolved in PTC Mathcad. This information technology and leading engineering calculations software is the number one tool for designers and engineers in the industry. Download the PTC Mathcad Prime 5.0 brochure.
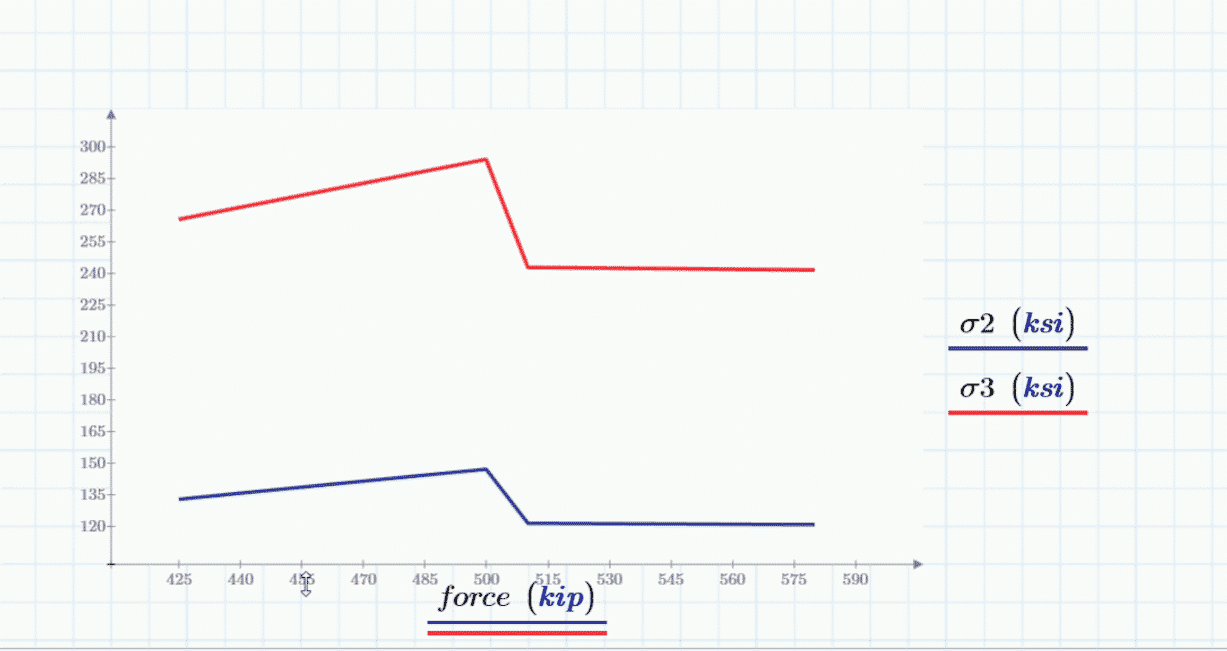
Let’s talk about plots. PTC listened to their customers and responded to suggestions and requests needed for Mathcad Prime. The old plotting method is still available for those that need to use it, although the new improvements gave plots the abilities to add a title, a legend, gridlines, axis labels, a 2nd y-axis, and richer formatting options.
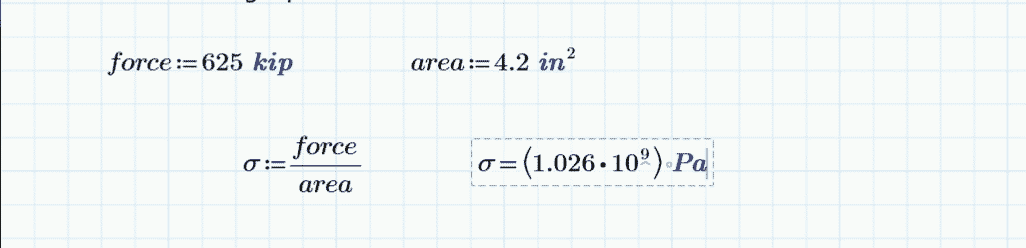
Anji demonstrates how you can calculate stress using input variables of force and area on your Mathcad worksheet:
The original way to create a plot in PTC Mathcad Prime 4.0 was to go to the ‘plots’ tab and click ‘insert plot’ – this function is still here.
With the old way (which you can still use), you would follow these instructions:
-insert plot
-x-axis= force
-y-axis= σ2
You can see that ‘force’ and ‘σ2’ are names of variables that store our mathematical data – but they are NOT labels. You cannot add the labels using this old method (but you can with the new).
The new way is NOT on the plots tab – it’s on the math tab – called the ‘chart component’.
-go to ‘math’ tab
-click on ‘chart component’
-right click on the chart, click on ‘insert x-axis expression’
-right click on the chart, click on ‘insert y-axis expression’
On previous version of Mathcad you could not enter a 2nd y-axis. Now you can:
-right click on the chart, click on ‘insert y-axis expression’
In the chart component you can access all the rich format options in one place with a lot more room to make the plot the way you want it to look with styles, the legend, a title and where you’d like the location of all of these components to be while being able to change background, text, and line colors, borders, and opacity settings.
PTC Mathcad helps you calculate and solve engineering problems. Much more can be done in charting your 2D plots in Mathcad Prime 5.0 – watch the webinar replay here.
PTC Mathcad Prime delivers powerful engineering calculation management to help predict design behavior, drive critical parameters and dimensions, and enhance the visualization of your data with 2D plotting. Since there was a lot of feedback from users that there needed be improvements to the plotting features in previous Mathcad releases, Mathcad Prime 5.0 is almost entirely focused on enhancements to 2D plots.
New Capabilities of Mathcad Prime 5.0
The new capabilities dramatically improve user’s ability to customize the look and layout of their charts and graphs to better convey information to stakeholders. Prime 5.0 adds a new button under the Math tab called the ‘Chart Component.’ The plots tab will look the same as previous versions of Mathcad because nothing has been removed, only augmented for the addition of the new chart component.

This image shows users where they can find the new charting component in Mathcad Prime 5.0.
Previous to the new release, users were unable to fully control a title, a legend, gridlines, a 2nd y axis, or custom formatting when creating a plot graph under the plots tab. These capabilities are now available in Mathcad Prime 5.0!
Using the new ‘Chart Component’ in Mathcad
Insert a chart component under the math tab – this will insert an empty embedded charting object. If you double click on it, then you can activate the charting application.
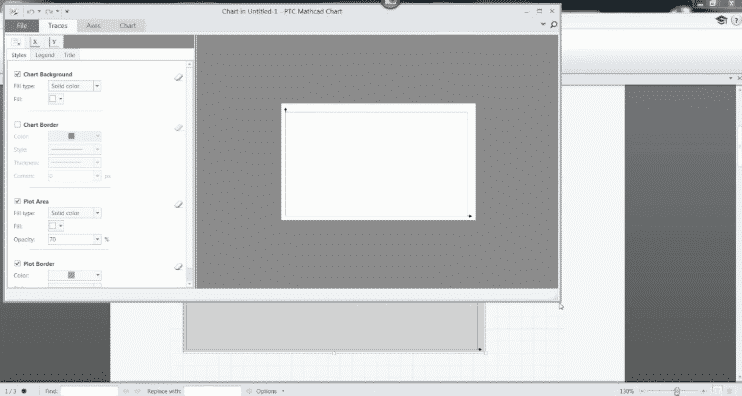 This image shows users the activated charting application once the embedded object is double clicked.
The user can now access all the functionalities of the application that help customize the chart under the plot tab, the x tab, and the y tab such as the title, a border, gridlines, a legend, font, and colors.
Once you close this tab you will see your document again and notice that there is an area above your chart component that says ‘Inputs’. This is where you define the data or function that is needed for the chart to be plotted. You can define either functions or variables that store data. If you click on this section you will see a dropdown of various options in which you can choose to either ‘Insert X-Axis Expression’ or ‘Insert Y-Axis Expression’.
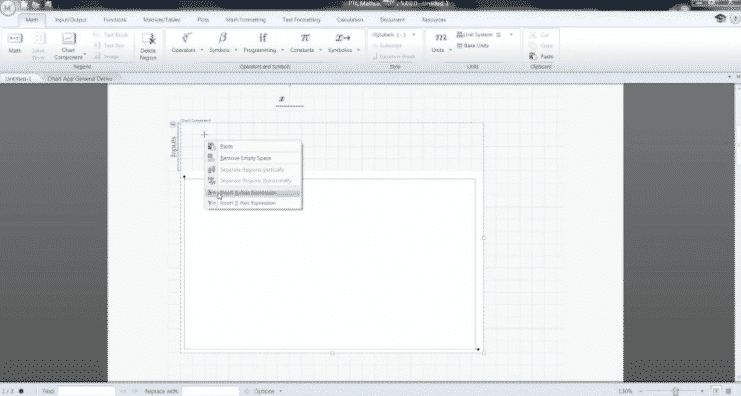 This image shows the user where they can access the insertion of an x and y axis expression in their chart.
Once you’ve entered your x and y axis data, you can double click on the plot again to access a preview of your plot and customize the chart details.
To see what else you can do with Mathcad Prime 5.0, watch PTC’s Anji Seberino demonstrate the advanced chart options available to users by clicking on the video below.